

1.はじめに
重要文化財の耐震診断や耐震補強を行う際に土壁の耐震性能をどのように評価したらよいか、について検証した結果を下記に記します。
これで構造設計事務所のスタッフの苦労が少しでも無くなれば良いのですが。
2.概要
重要文化財の耐震診断の方法は、文化庁の「重要文化財(建造物)耐震基礎診断実施要領」という資料(以下、文化庁資料)に示されています。
その中で土壁の荷重-変形関係が示されていますが、そのグラフは初期剛性とエネルギーで表現されています。midas Genなど汎用解析プログラムに入力するためにはグラフの各点の荷重と変形の値が必要なため、文化庁の資料の初期剛性とエネルギーを荷重と変形の値に換算する必要があります。
計算自体は方程式を解くだけなのですが、「計算結果は本当に正しいのか?」「プログラムに入力した荷重-変形関係は本当に正しいのか?」と不安になります。
ここでは上記の計算結果と、日本建築防災協会(以下、建防協)の「2012 木造住宅の耐震診断と補強方法 例題編・資料編」(以下、建防協資料)の土壁の荷重-変形関係のグラフを比較して検証しました。
3.文化庁資料の荷重-変形関係の換算
「全面土壁の初期剛性及び限界エネルギー」として下表が与えられています。
| 初期剛性 N/m/m | 損傷限界E N*m/m | 機能限界E N*m/m | 倒壊限界E N*m/m |
| 10,000,000t/h | 297th | 880th | 4,130th |
E : エネルギー、t : 壁厚(m)、h : 階高(m)
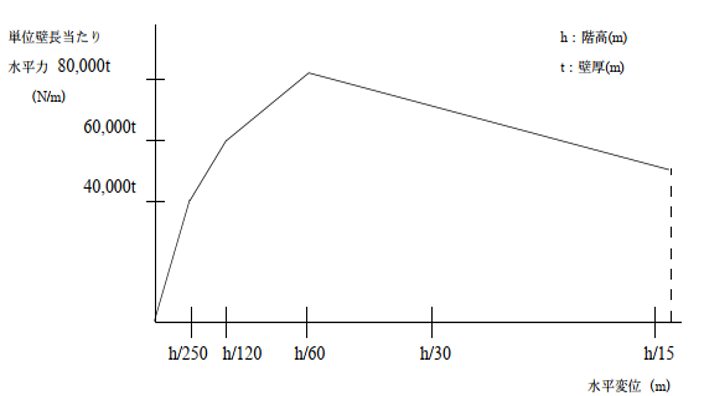
※表、グラフ共に「重要文化財(建造物)耐震基礎診断実施要領」より抜粋
変位 0 – h/250区間
面積 = 底辺*高さ*1/2 = (h/250) * 40,000t * (1/2) = 80th = 初期剛性範囲のE
変位 h/250 – h/120区間
台形の面積 = 損傷限界E – 初期剛性範囲のE = 297th – 80th = 217th
台形の面積 = (上底+下底)*高さ*1/2 = (40,000t + Y)*(h/120 – h/250) * 1/2
上式 = 217th より、tに関して整理すると、Y = 60,154t (損傷限界)
以降同様に、Y=79,766t (機能限界)、Y=50,234t (倒壊限界)
上記よりグラフの各折れ点の荷重と変形が分かる。
4.建防協資料の荷重-変形関係の換算
建防協の資料は荷重-変形角として下表が与えられています。(t=70mm)
| 変形角θ [*10-3rad] | 0 | 1.0 | 2.0 | 3.0 | 5.0 | 8.0 |
| 荷重 [kN/m] | 0 | 1.36 | 1.96 | 2.39 | 3.17 | 3.76 |
| 変形角θ [*10-3rad] | 10.0 | 15.0 | 20.0 | 30.0 | 40.0 | 60.0 |
| 荷重 [kN/m] | 4.15 | 4.47 | 4.69 | 4.45 | 4.43 | 4.37 |
5.比較
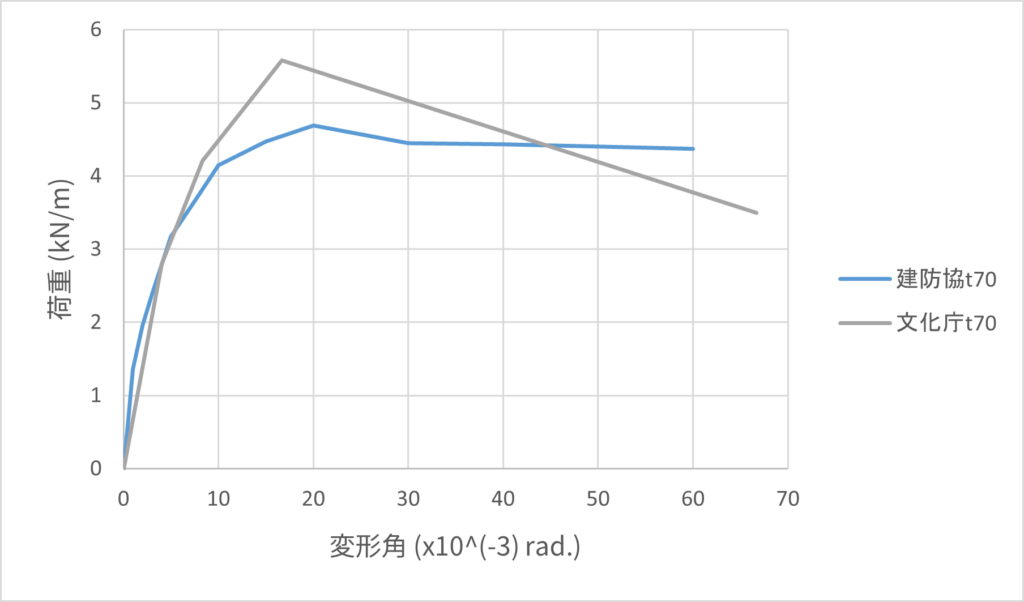
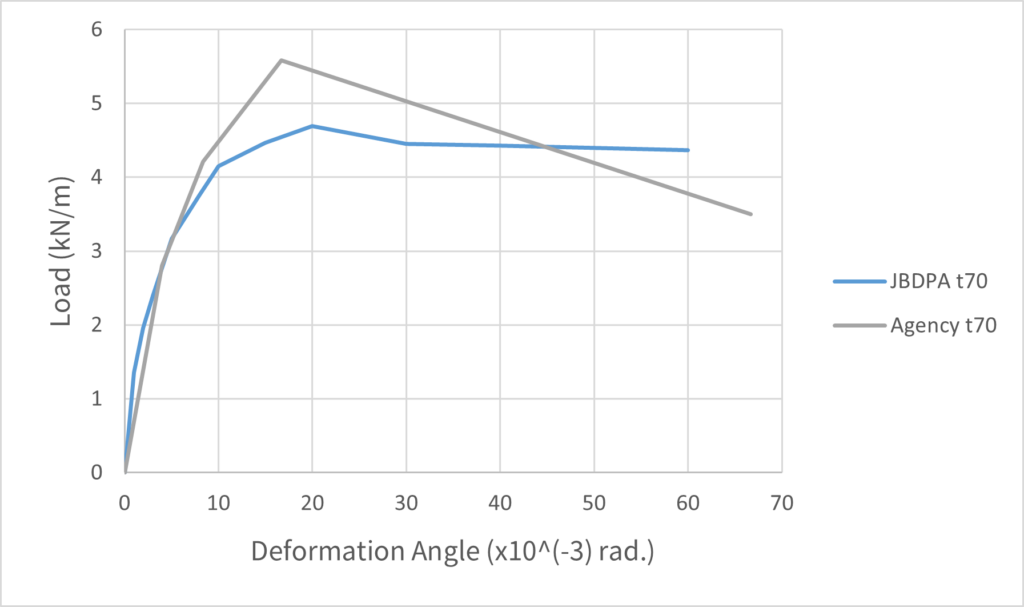
文化庁資料と建防協資料を比較したグラフは下記の通りです。前提条件が異なる両者が概ね同じ傾向になることから、文化庁資料の初期剛性とエネルギーの式を荷重-変形角に換算した式は適切と判断します。
6.マルチリニアの荷重-変形関係
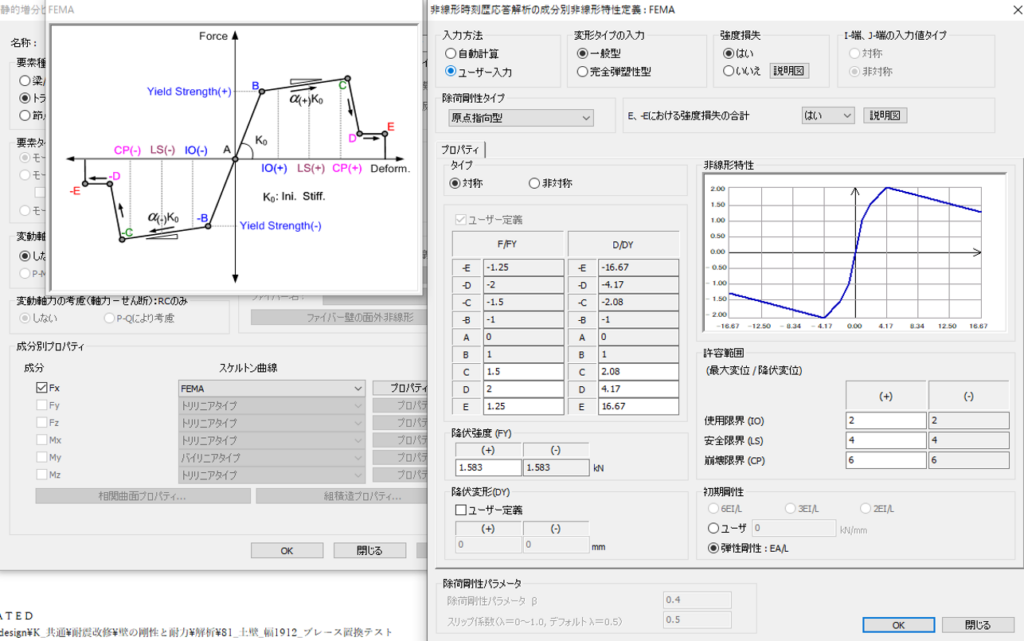
midas Genでのマルチリニアの荷重-変形関係の入力例と増分解析結果は下記になります。

7.結論
上記のやり方で重要文化財の土壁の耐震性能は評価することができますが、負勾配の特性を持つ増分解析となりますので、土壁が複数ある場合は増分解析の結果が「どの荷重でどの壁が降伏したか」が分かりづらいものとなります。
実務としては土壁の荷重-変形関係をバイリニア(初期剛性はそのまま、面積は等価)に置換した方が分かりやすく、運用しやすいと思います。
私はここまでやって、自分の師匠に言われた「シンプルに考えろ」や、佐藤淳さんが講演会で仰っていた「構造は省略の技芸」という言葉が改めて身に沁みました。
1.Introduction.
The following presents the results of our study on how to evaluate the seismic performance of earthen walls when conducting seismic assessment and retrofitting of Important Cultural Properties.
We hope this will help reduce the challenges faced by structural design office staff, even if only a little.
2.Overview
The method for seismic assessment of Important Cultural Properties is outlined in the document titled “Seismic Basic Diagnosis Guidelines for Important Cultural Properties (Buildings)” published by the Agency for Cultural Affairs (hereinafter referred to as the Agency Document).
In this document, the load-deformation relationship of earthen walls is presented as a graph expressed in terms of initial stiffness and energy. However, in order to input this data into general analysis programs such as Midas Gen, the load and deformation values at each point of the graph are required. Therefore, it is necessary to convert the initial stiffness and energy values from the Agency Document into load and deformation values.
Although the calculation itself is simply solving an equation, concerns remain, such as “Are the calculation results really correct?” and “Is the load-deformation relationship input into the program accurate?”
Here, we verify the calculation results by comparing them with the load-deformation relationship graph of earthen walls found in the 2012 Seismic Diagnosis and Retrofit Methods for Wooden Houses: Example & Reference Volume published by the Japan Building Disaster Prevention Association (hereinafter referred to as the JBDPA Document).
3.Conversion of load-deformation relationships in the Agency Document.
The following table is provided as ‘Initial Stiffness and Limit Energy of Fully Earthen Walls’.
| Initial Stiffness N/m/m | Damage Limit E N*m/m | Functional Limit E N*m/m | Collapse Limit E N*m/m |
| 10,000,000t/h | 297th | 880th | 4,130th |
E : energy、t : tickness(m)、h : height(m)
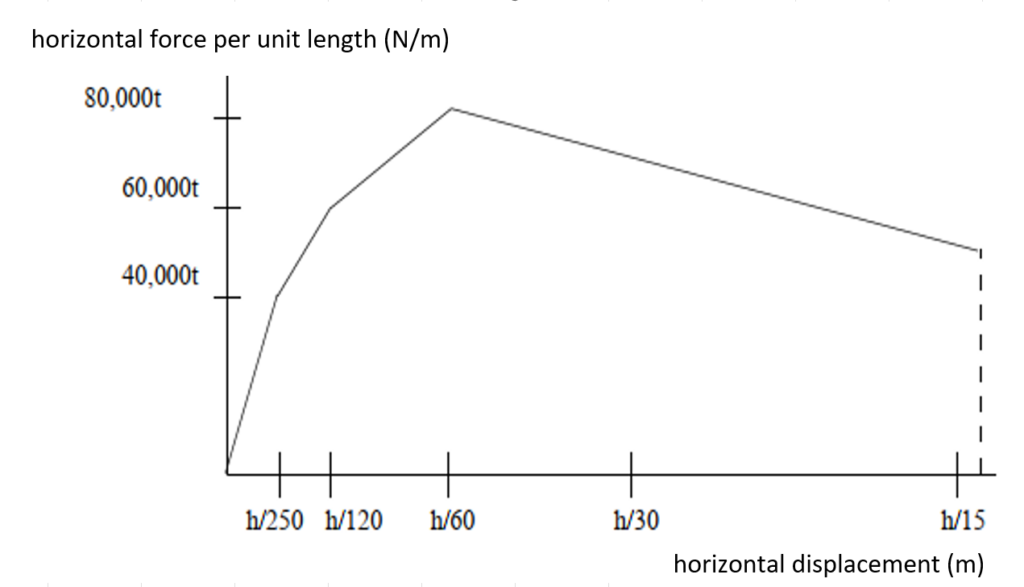
※Both the table and the graph are excerpts from the ‘Seismic Basic Diagnosis Guidelines for Important Cultural Properties (Buildings).’
Displacement 0 – h/250 range
Area = Base*Height1/2 = (h/250) * 40,000t * (1/2) = 80th = Energy of Initial Stiffness range
Displacement h/250 – h/120 range
Area of trapezoid = Damage Limit E – E of initial stiffness range = 297th – 80th = 217th
Area of trapezoid = (top base + bottom base)height1/2 = (40,000t + Y)*(h/120 – h/250) * 1/2
From the above equation = 217th , organised with respect to t, Y = 60,154t (Damage Limit)
In the same way, Y = 79,766t (Functional Limit) and Y = 50,234t (Collapse Limit).
From the above, the loads and deformations at each of the graph’s turning points can be determined.
4.Conversion of load-deformation relationship in the JBDPA Document
The JBDPA Document provides the load-deformation angle as shown in the table below. (t=70mm)
| Deformation Angle θ [*10-3rad] | 0 | 1.0 | 2.0 | 3.0 | 5.0 | 8.0 |
| Load [kN/m] | 0 | 1.36 | 1.96 | 2.39 | 3.17 | 3.76 |
| Deformation Angle θ [*10-3rad] | 10.0 | 15.0 | 20.0 | 30.0 | 40.0 | 60.0 |
| Load [kN/m] | 4.15 | 4.47 | 4.69 | 4.45 | 4.43 | 4.37 |
5.Comparison
The graph comparing the Agency document and the JBDPA Document is shown below. Since both, despite having different assumptions, exhibit roughly the same trend, we conclude that the equation converting the initial stiffness and energy from the Agency Document into load-deformation angle is appropriate.
6.Multilinear load-deformation relationships
An example of a multilinear load-deformation relationship input in midas Gen and the results of an push-over analysis are shown below.
7.Conclusion
Using the above method, the seismic performance of important cultural property earthen walls can be evaluated. However, since this involves an push-over analysis with negative stiffness characteristics, it becomes difficult to determine which wall yields at what load when multiple earthen walls are present.
In practical applications, it is often clearer and more manageable to approximate the load-deformation relationship of earthen walls as bilinear (maintaining the initial stiffness while ensuring an equivalent area).
Going through this process, I was once again reminded of my mentor’s words, ‘Keep it simple,’ and structural engineer Jun Sato’s statement in a lecture: ‘Structural engineering is the art of omission.